ACRN Real-Time (RT) Performance Analysis
The document describes the methods to collect trace/data for ACRN real-time VM (RTVM) real-time performance analysis. Two parts are included:
Method to trace
vmexitoccurrences for analysis.Method to collect Performance Monitoring Counters information for tuning based on Performance Monitoring Unit, or PMU.
vmexit Analysis for ACRN RT Performance
vmexit are triggered in response to certain instructions and events and are
a key source of performance degradation in virtual machines. During the runtime
of a hard RTVM of ACRN, the following impacts real-time deterministic latency:
CPUID
TSC_Adjust read/write
TSC write
APICID/LDR read
ICR write
Generally, we don’t want to see any vmexit occur during the critical section of the RT task.
The methodology of vmexit analysis is very simple. First, we clearly
identify the critical section of the RT task. The critical section is
the duration of time where we do not want to see any vmexit occur.
Different RT tasks use different critical sections. This document uses
the cyclictest benchmark as an example of how to do vmexit analysis.
The Critical Sections
Here is example pseudocode of a cyclictest implementation.
while (!shutdown) {
      ...
      clock_nanosleep(&next)
      clock_gettime(&now)
      latency = calcdiff(now, next)
      ...
      next += interval
}
Time point now is the actual point at which the cyclictest app is woken up
and scheduled. Time point next is the expected point at which we want
the cyclictest to be awakened and scheduled. Here we can get the latency by
now - next. We don’t want to see a vmexit in between next and now.
So, we define the starting point of the critical section as next and
the ending point as now.
Log and Trace Data Collection
Add time stamps (in TSC) at
nextandnow.Capture the log with the above time stamps in the RTVM.
Capture the
acrntracelog in the Service VM at the same time.
Offline Analysis
Convert the raw trace data to human readable format.
Merge the logs in the RTVM and the ACRN hypervisor trace based on time stamps (in TSC).
Check to see if any
vmexitoccurred within the critical sections. The pattern is as follows: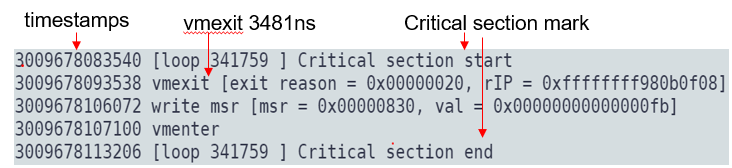
Collecting Performance Monitoring Counters Data
Performance Monitoring Unit (PMU) Support for the RTVM
By default, the ACRN hypervisor exposes the PMU-related CPUID and MSRs to the RTVM. Note that Precise Event Based Sampling (PEBS) is not yet enabled in the VM.
Perf/PMU Tools in Performance Analysis
Since users no longer need to expose PMU-related CPUID/MSRs to the VM, performance analysis tools
such as perf and PMU can be used inside the VM to locate
the bottleneck of the application.
Perf is a profiler tool for Linux 2.6+ based systems that abstracts away
CPU hardware differences in Linux performance measurements and presents a
simple command-line interface. Perf is based on the perf_events interface
exported by recent versions of the Linux kernel.
PMU tools is a collection of tools for profile collection and
performance analysis on Intel CPUs on top of Linux Perf. Refer to the
following links for perf usage:
Refer to https://github.com/andikleen/pmu-tools for PMU usage.
Top-Down Microarchitecture Analysis Method (TMAM)
The top-down microarchitecture analysis method (TMAM), based on top-down characterization methodology, aims to provide an insight into whether you have made wise choices with your algorithms and data structures. See the Intel® 64 and IA-32 Architectures Optimization Reference Manual, Appendix B.1 for more details on TMAM. Refer to this technical paper that adopts TMAM for systematic performance benchmarking and analysis of compute-native Network Function data planes that are executed on commercial-off-the-shelf (COTS) servers using available open-source measurement tools.
Example: Using Perf to analyze TMAM level 1 on CPU core 1:
perf stat --topdown -C 1 taskset -c 1 dd if=/dev/zero of=/dev/null count=10
10+0 records in
10+0 records out
5120 bytes (5.1 kB, 5.0 KiB) copied, 0.00336348 s, 1.5 MB/s

Performance counter stats for 'CPU(s) 1':

        retiring bad speculation frontend bound backend bound
S0-C1 1 10.6%               1.5%           3.9%         84.0%

0.006737123 seconds time elapsed