ACRN Debugging Tools
This document describes how to use ACRN tools to collect log and trace data for debugging.
ACRN Console Command
The ACRN console provides shell commands for a user to check system states
and environment settings. See the ACRN Shell Commands documentation for a
full list of commands, or see a summary of available commands by using
the help command within the ACRN shell.
An example
As an example, we’ll show how to obtain the interrupts of a pass-through USB device.
First, we can get the USB controller BDF number (0:15.0) through the following command in the SOS console:
lspci | grep "USB controller"

Figure 218 USB controller BDF information
Second, we use the pt command in the ACRN console, and use this BDF number
to find the interrupt vector (VEC) “0x31”.
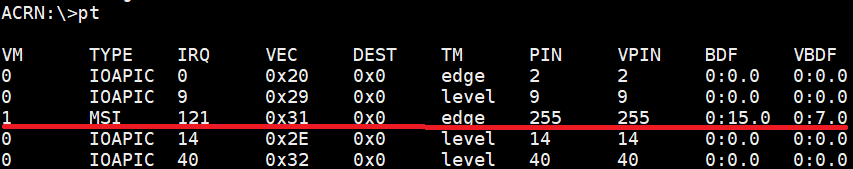
Figure 219 USB controller interrupt information
Finally we use the int command in the ACRN console, and use this
interrupt vector to find the interrupt number (909) on CPU3.
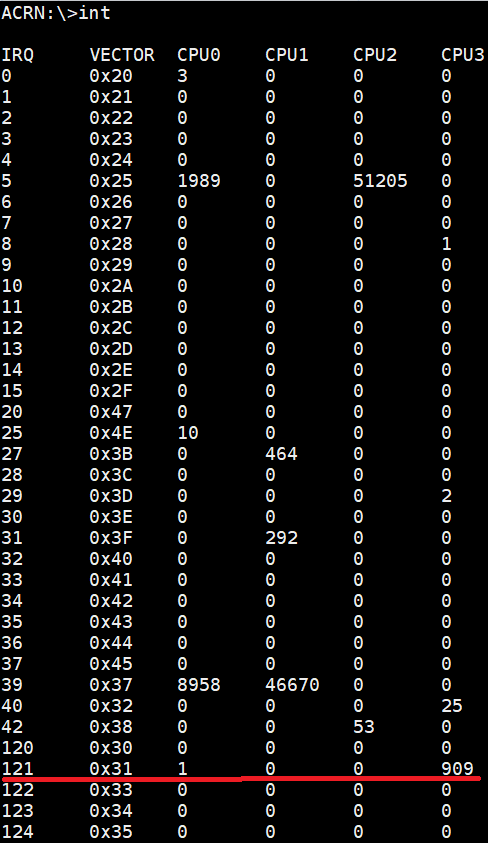
Figure 220 USB controller interrupt number information
ACRN Log
ACRN log provides console log and mem log for a user to analyze. We can use console log to debug directly, while mem log is a userland tool used to capture a ACRN hypervisor log.
Turn on the logging info
ACRN enables a console log by default.
To enable and start the mem log:
$ systemctl enable acrnlog
$ systemctl start acrnlog
Set and grab log
We have 1-6 log levels for console log and mem log. The following functions print different levels of console log and mem log:
pr_dbg("debug...level %d", LOG_DEBUG);       //level 6
pr_info("info...level %d", LOG_INFO);        //level 5
pr_warn("warn...level %d", LOG_WARNING);     //level 4
pr_err("err...level %d", LOG_ERROR);         //level 3
pr_acrnlog("acrnlog...level %d", LOG_ACRN);  //level 2
pr_fatal("fatal...level %d", LOG_FATAL);     //level 1
If the built-in logging doesn’t provide enough information, you can add
additional logging in functions you want to debug, using the functions
noted above. For example, add the following code into function
shell_cmd_help in the source file
acrn-hypervisor/hypervisor/debug/shell.c:
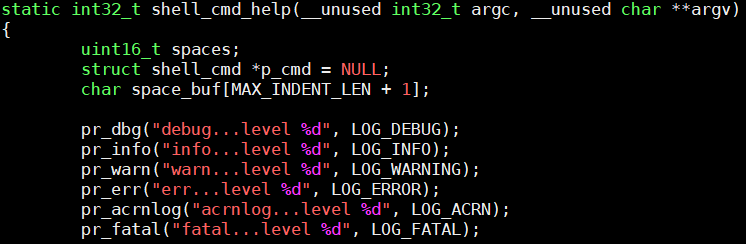
Figure 221 shell_cmd_help added information
Once you have instrumented the code, you need to rebuild the hypervisor and install it on your platform. Refer to Build ACRN from Source and Getting started guide for Intel NUC for detailed instructions on how to do that.
We set console log level to 5, and mem log level to 2 through the command:
loglevel 5 2
Then we input help into the ACRN console (this is the command that we have
just instrumented with additional log information), and check the log as follows.
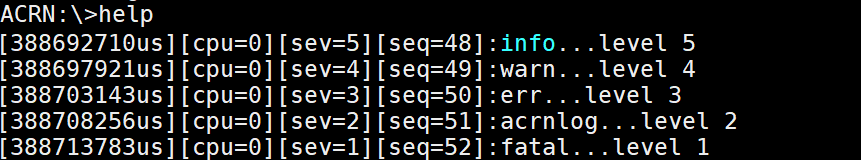
Figure 222 console log information
Then we use the command, on the ACRN console:
vm_console
to switch to the SOS console. Then we use the command:
cat /tmp/acrnlog/acrnlog_cur.0
and we will see the following log:

Figure 223 mem log information
ACRN Trace
ACRN trace is a tool running on the Service OS (SOS) to capture trace data. We can use the existing trace information to analyze, and we can add self-defined tracing to analyze code which we care about.
Using Existing trace event id to analyze trace
As an example, we can use the existing vm_exit trace to analyze the reason and times of each vm_exit after we have done some operations.
Run the following SOS console command to collect trace data:
# acrntrace -cCheck current directory, and confirm the directory contains four trace files:
# ls
0 1 2 3
Use the command to get a summary of vmexit:
# acrnalyze.py -i /home/trace/acrntrace/20190219-001529/1 -o vmexit --vm_exitNote
The acrnalyze.py script is in the
acrn-hypervisor/tools/acrntrace/scriptsfolder. The location of the trace files produced byacrntracemay be different in your system.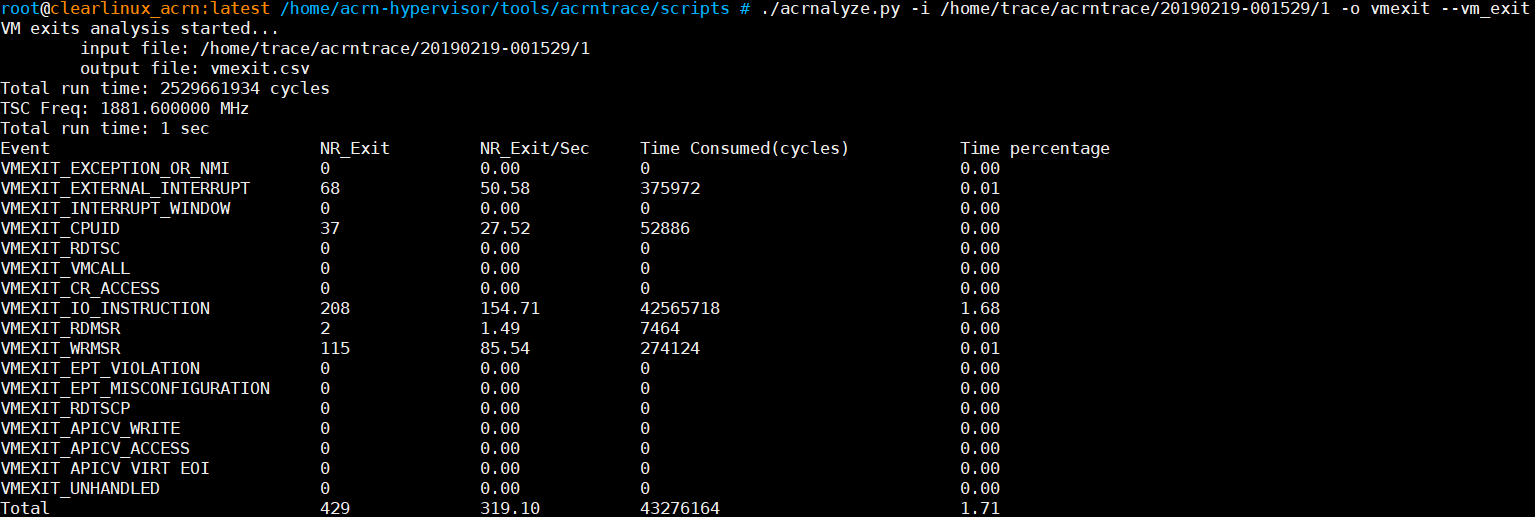
Figure 224 vmexit summary information
Using Self-defined trace event id to analyze trace
For some undefined trace event id, we can define it by ourselves as shown in the following example:
Add the following new event id into
acrn-hypervisor/hypervisor/include/debug/trace.h: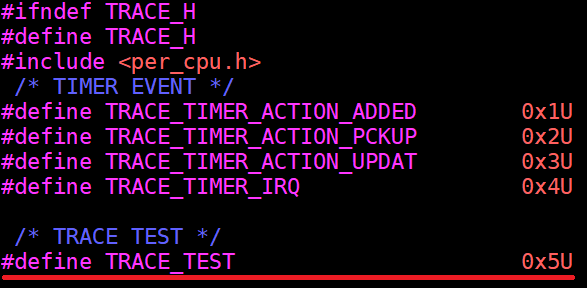
Figure 225 trace event id
Add the following format to
acrn-hypervisor/tools/acrntrace/scripts/formats: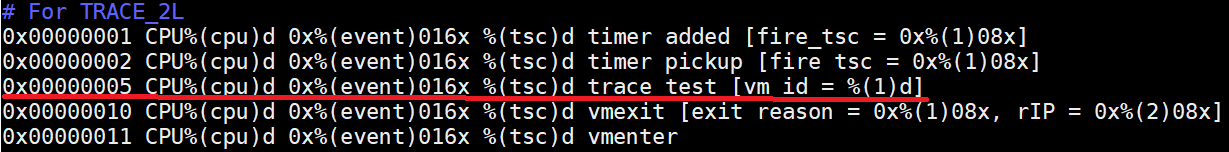
Figure 226 acrntrace formatted information
Note
- Formats:
0x00000005: event id for trace test
%(cpu)d: corresponding cpu index with ‘decimal’ format
%(event)016x: corresponding event id with ‘hex’ format
%(tsc)d: corresponding event time stamp with ‘decimal’ format
%(1)08x: corresponding first ‘Long’ data in TRACE_2L
Add trace into function
emulate_ioinacrn-hypervisor/hypervisor/arch/x86/guest/io_emul.cwhich we want to trace for the calling times of functionemulate_io: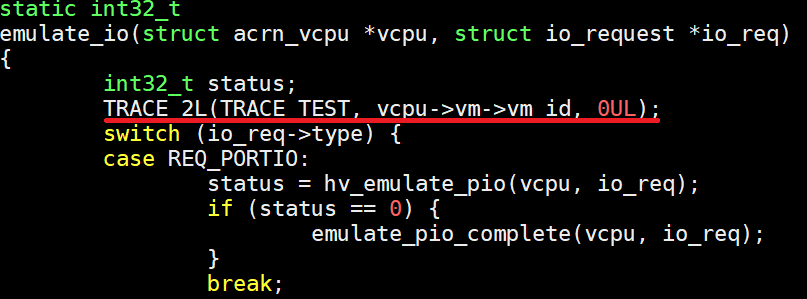
Figure 227 inserted trace information
After we have inserted the trace code addition, we need to rebuild the ACRN hypervisor and install it on the platform. Refer to Build ACRN from Source and Getting started guide for Intel NUC for detailed instructions on how to do that.
Now we can use the following command in the SOS console to generate acrntrace data into the current directory:
acrntrace -c

Figure 228 trace collection
Run the console command:
# acrntrace_format.py \
  formats /home/trace/acrntrace/20190219-001529/1 | grep "trace test"
Note
The acrnalyze.py script is in the
acrn-hypervisor/tools/acrntrace/scriptsfolder. The location of the trace files produced byacrntracemay be different in your system.and we will get the following log:
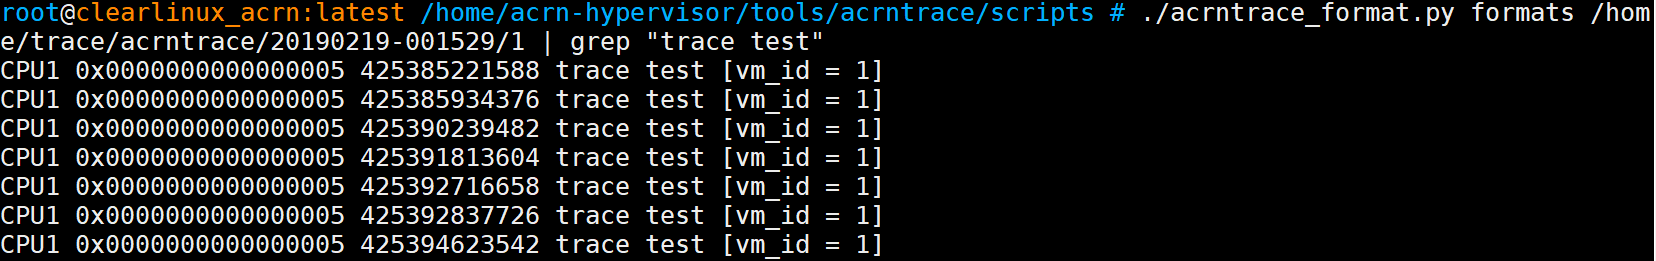
Figure 229 trace collection
Note
The trace data may generate on any of the available CPUs, so you’ll need to check which CPU number was used and specify that CPU to analyze its trace.